For many years now, energy suppliers have been rolling out “smart meters” to home across the UK. It has largely been promoted as a way to let consumers reduce their consumption by watching their energy usage on an in home display (IHD) gadget. This is massively under selling the potential benefits of smart meters, and combined with various other reasons, leaves many unenthusiastic about the change. A few more adventurous suppliers, most prominently Octopus Energy, are taking advantage of smart meters to offer innovative dynamic tariffs, which particularly benefit those with electric vehicles.
I have been exploring the possibility of a solar PV installation at home and after talking to various suppliers have been left feeling quite underwhelmed with the reports they provide with their quotations. Typically a selection of crude 2-dimensional charts showing potential generation per month and some rough estimate of how much grid import will be reduced and grid export available based on your yearly kwh usage figure. They’ll only illustrate one or two scenarios, so it is hard to understand the impact of altering the number of panels requested, or sizing of any battery storage.
The European PVGIS service provides a good site where you can visualize the solar generation at your home based on actual recorded atmospheric conditions from history (typically their data lags current day by 2-3 years). They still only make use of your yearly kwh consumption figure with a generic model to estimate benefits. With a smart meter I have historic electricity consumption for my home in kwh at 30 minute granularity. Match that against the PVGIS data and its possible to produce a fine grained simulation of solar PV generation potential against consumption.
And so came forth the idea of a simple python script I’m calling “smartsolar” to combine PVGIS data with smart meter data and produce reports evaluating potential deployment options. It can use smart meter records downloaded from n3rgy (compatible with any UK supplier once registered), or from Octopus Energy‘s customer portal. Using plotly the reports contain 3-dimensional interactive charts showing data day-by-day, hour-by-hour. Changing the configuration file lets you quickly evaluate many different deployment scenarios to understand the tradeoffs involved.
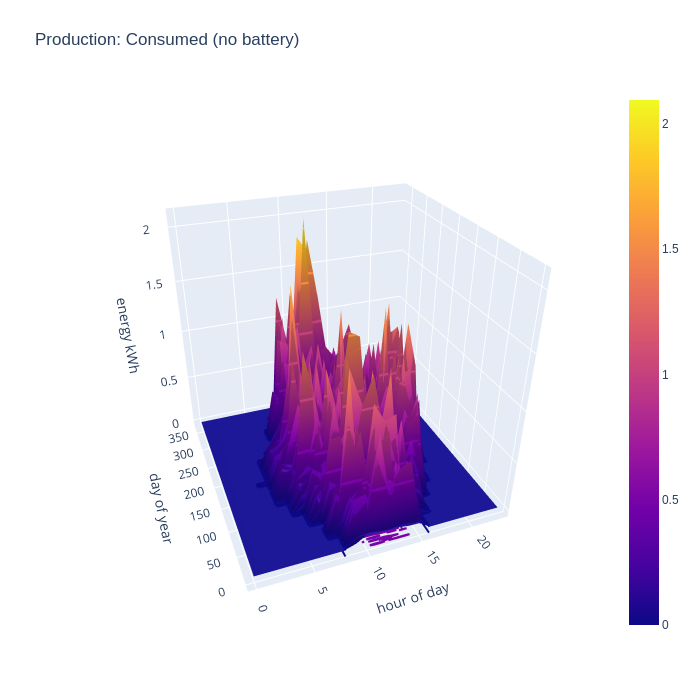
In the charts (screenshots of a fixed POV only, non-interactive) that follow I’m evaluating an arbitrary installation with 10 panels on a south-east orientation and 6 panels on a north-west orientation, panels rated at 400W, along with 10 kwh of battery storage. The smart meter consumption data covers primarily 2023, while the PVGIS generation data is from 2019, the latest currently available.
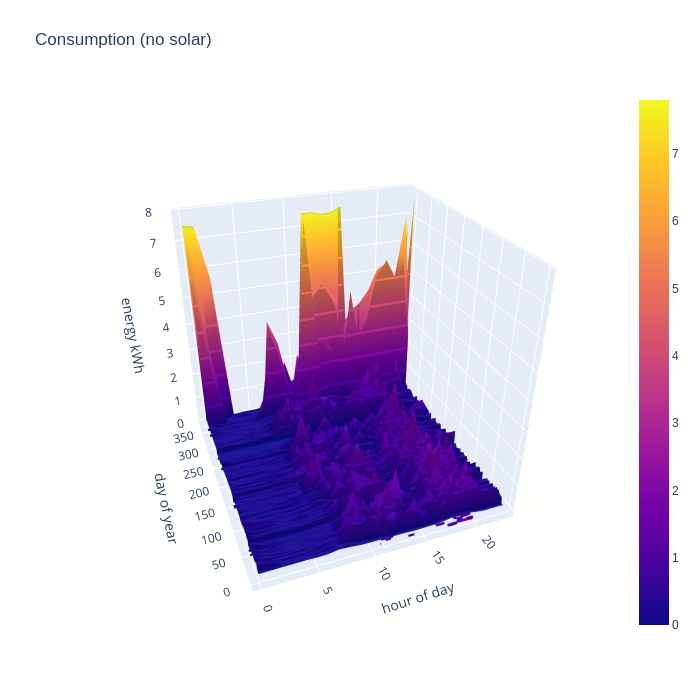
The first chart shows the breakdown of consumption data and exposes some interesting points. The consumption is broadly consistent from day-to-day across the whole year and is spread fairly flat across the time period from 8am to 11pm. This reflects the effects of full time remote working. Someone office based would likely see consumption skewed towards the evenings with less in the middle of the day. The enormous nighttime peaks in consumption in the last month of the year reflect the fact that I acquired an electric vehicle and started charging it at home on a Zappi. The huge day time usage peak was a side effect of replacing our heating system in Dec, which required temporary use of electric heaters. NB, the flat consumption around Sept timeframe is a result of me accidentally loosing about 25 days of smart meter data.
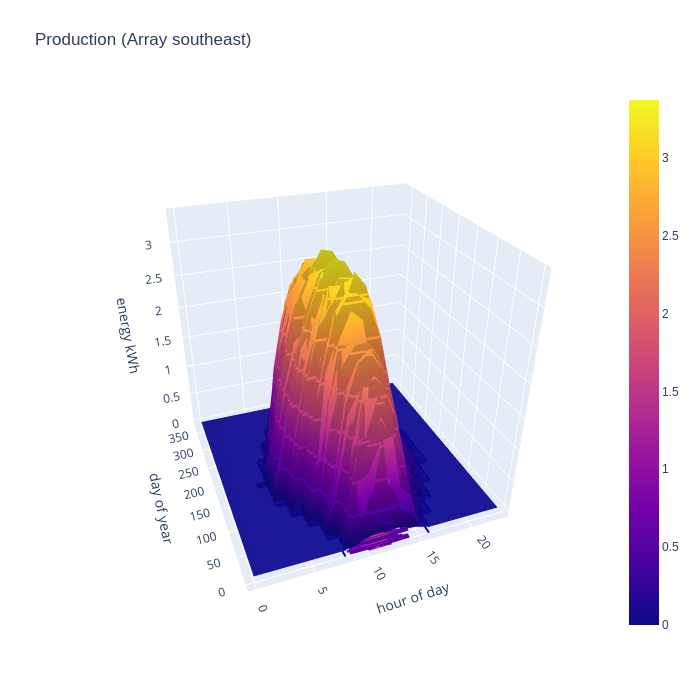
The next two charts give the real world PV generation of the two hypothesized solar arrays, based on the 2019 PVGIS data source. The larger south east facing array starts generating as early as 5am in the middle of summer, but drops off sharply around 3pm. There is still useful generation in mid-winter from 8am till around 2pm, but obviously the magnitude is far below summer peak.
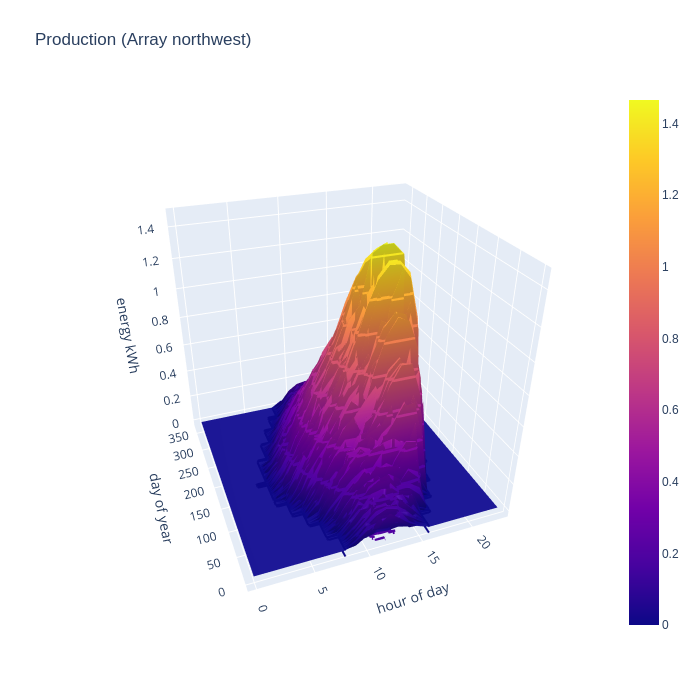
Conventional wisdom is that PV is a waste of time on predominantly north facing roofs, but what is the real world performance like ? The small north west facing array shows a gradual ramp in mid-summer from 6am to reach a peak at around 6pm, and drops off to nothing by 8pm. For the 2 months either side of mid-winter, the generation is so negligible to be called zero. The absolute peak is 1/2 that of the south-east array, but there are 10 panels south east and only 6 panels north west. So peak generation per panel is not too terrible on the north east side. The limitations are really about the terrible winter performance, and the skewing of generation towards the evening hours. The evening bias, however, is potentially quite useful since that could match quite well with some people’s consumption patterns and early evening is commonly when the national grid has highest CO/2 intensity per kwh.
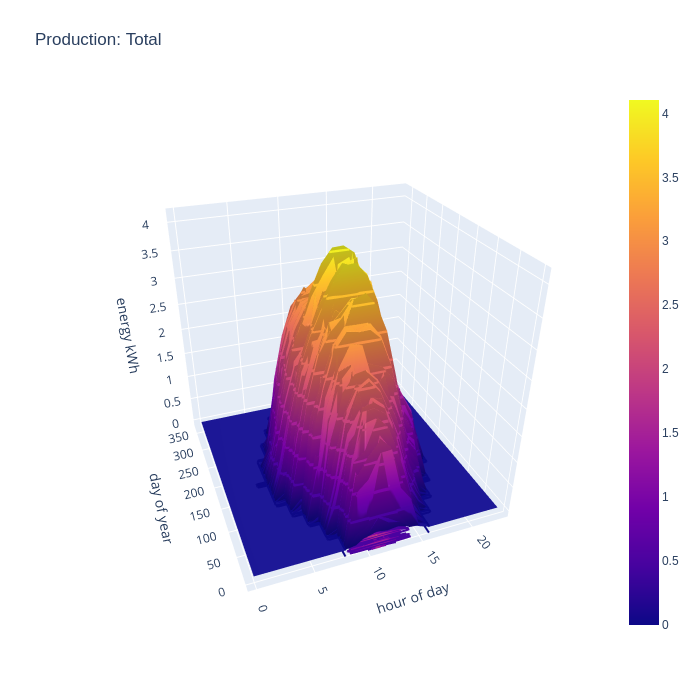
Seeing generation of each array separately is interesting in order to evaluate their relative performance. For comparison with consumption data though, a chart illustrating the combined generation of all arrays is more useful. This combined chart shows the south east and north west arrays complementing each other very well to expand the width of the peak generation time in the summer months, with peak summer output of 4kw per hour and covering the main hours of consumption. There is still useful improvement in the spring and autumn months, but winter is unchanged.
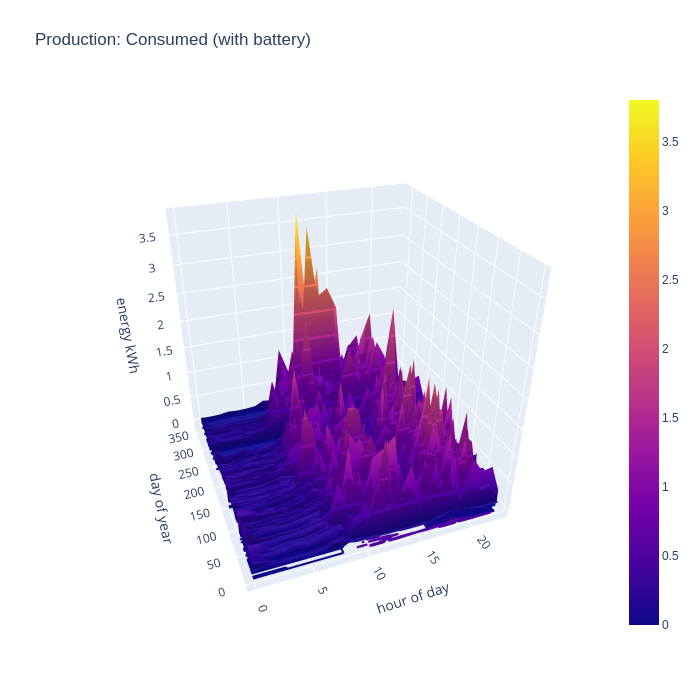
By taking the intersection of consumption and generation data, we can evaluate what subset of the generated energy is capable of being consumed at home, ignoring the possibility of battery storage. This chart shows the the generated energy can make a significant contribution to recorded consumption across the whole year. Obviously generated energy is only being consumed during daylight hours, since this chart discounts the usage of the any hypothetical home storage battery
It gets more interesting when taking into account the battery storage. This new chart shows that the house can run from self-generated energy around the clock for most of the year, but it especially shows how the battery can “time shift” generated energy into the evening once daylight has faded, but the house still has significant energy needs and continues to supply the house throughout the night even for some days in winter.
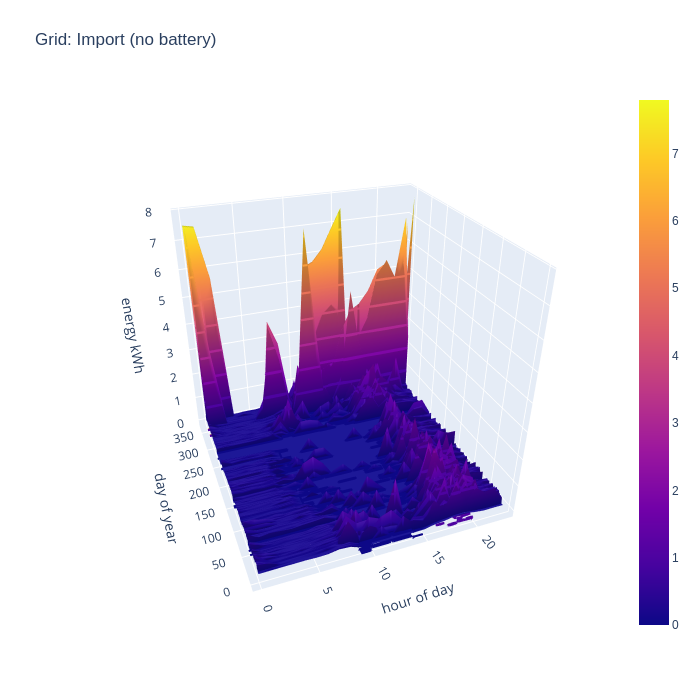
Another way of looking at the data is to consider how much energy is being imported from the national grid, as this indicates an inability to generate sufficient from the local PV arrays. First without the battery storage, it can be seen that in the middle of the day grid import is negligible outside of the winter months, but there is still considerable import in the evenings. The spikes from EV charging and temporary electric heaters are also still present. The winter months still show some significant grid import even in the middle of the day.
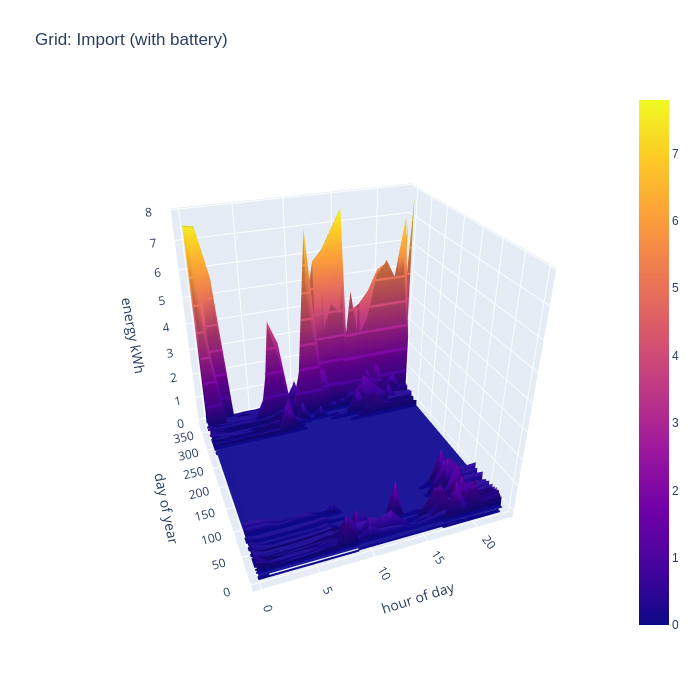
Adding in the battery storage calculations has a really dramatic impact on grid import. With 10kw of storage, there is enough buffer to be 100% self-sufficient in energy generation for 7 months of the year, which is a really astonishing result. A battery of this size obviously can’t address the peaks demanded by the EV charging periods, since the car battery capacity is well in excess of the home storage battery, but that’s to be expected.
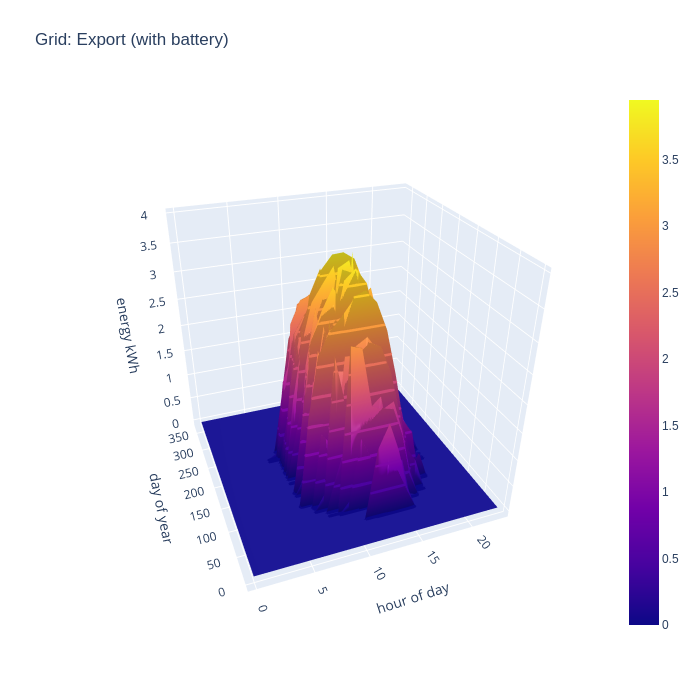
The total PV generation capacity over the year with the 16 panels is 5300 kwh while yearly consumption is only 3000 kwh, so clearly there is a lot of excess electricity going unused. To visualize this, a chart showing exports to the grid is useful to consider. Unsurprisingly, with no battery, we see strong grid export rates across all the day time hours when the panels are generating.
If we now add in the effects of a home battery, the grid export pattern changes somewhat. In winter months there is absolutely no grid export, with 100% of solar generation now able to be consumed locally, since demand far exceeds what is able to be generated in these months. In the rest of the months, export doesn’t start until an hour or two later in the morning. This shows the battery being recharged after overnight usage, until it is full and exporting of energy resumes.
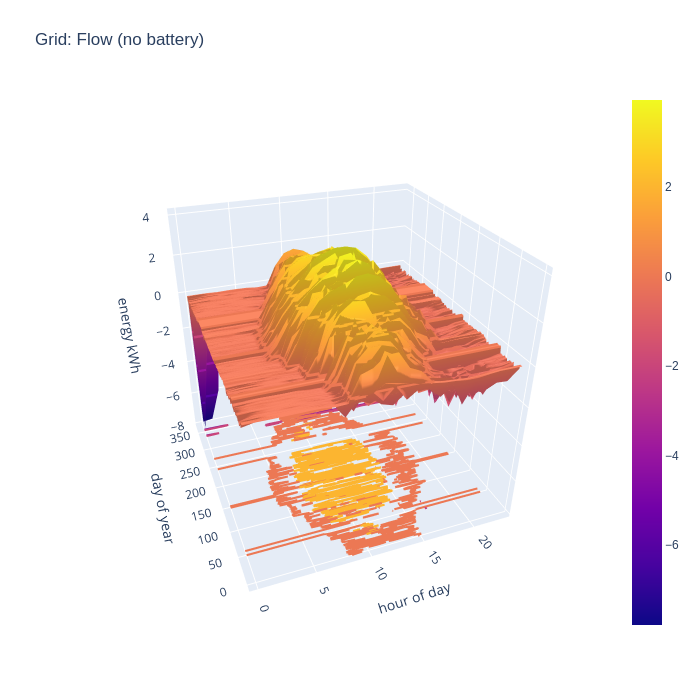
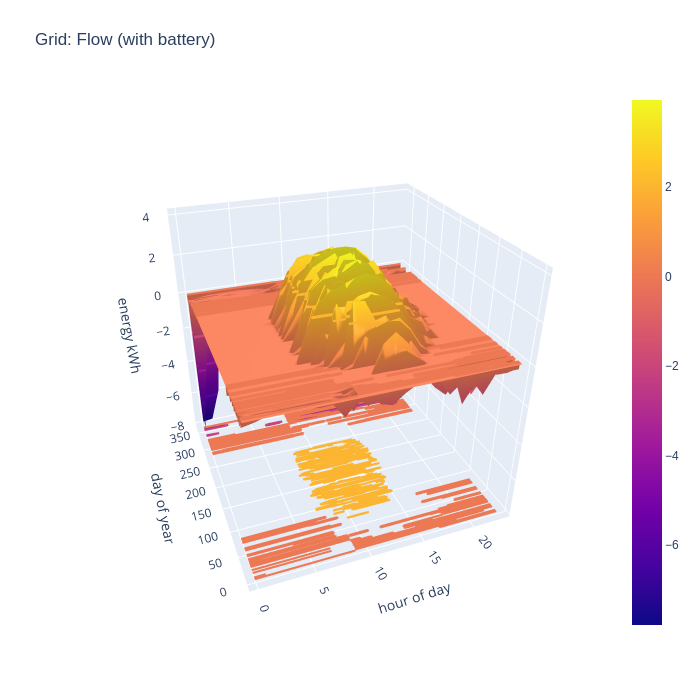
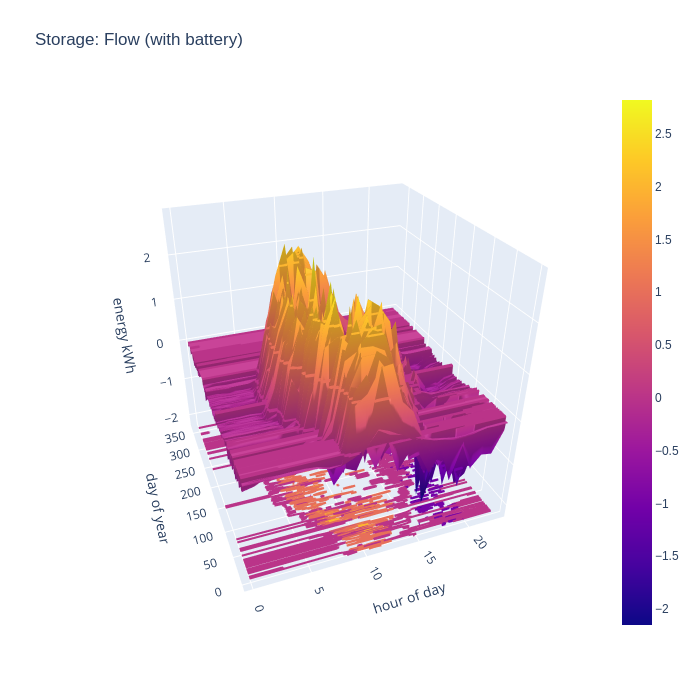
An alternative way to consider the grid import and export is to combine the two charts to illustrate the flow, with positive being export and negative being import. This nicely visualizes when the direction of flow flips during the day.
With battery storage taken into account, it is very apparent when there is neither grid import nor grid export during summer months.
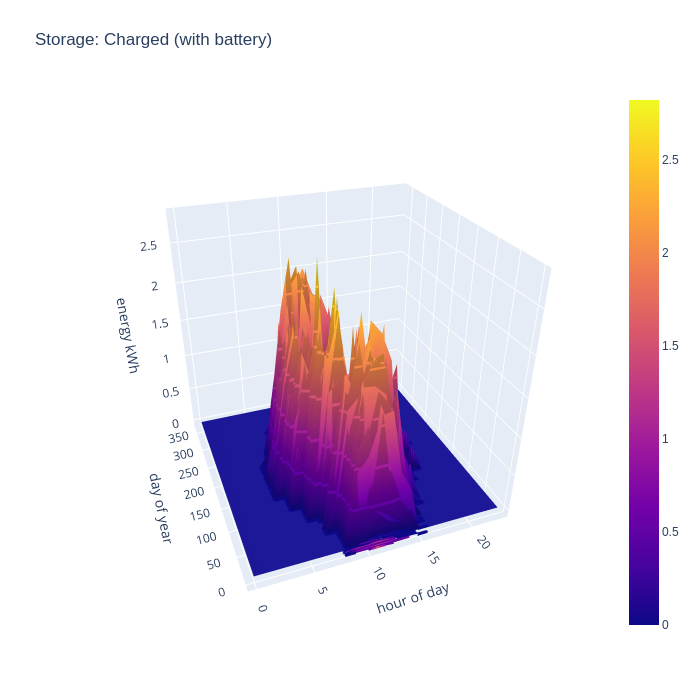
After considering the import and export rates for the grid, the final thing to look at is the charge and discharge rate of the battery storage. In terms of charging, the pattern broadly reflects the initial period of daylight hours throughout the year, as there is always either a slight mismatch in generation vs demand, or a huge surplus available. The battery typically fills up very quickly at the start of the day and remains that way for most of the day. This might suggest the need for a bigger battery, but the grid import chart shows that the house can run entirely from local consumption for 8 months of the year, an in winter months all PV generation is consumed, so there is not much to gain from a bigger battery.
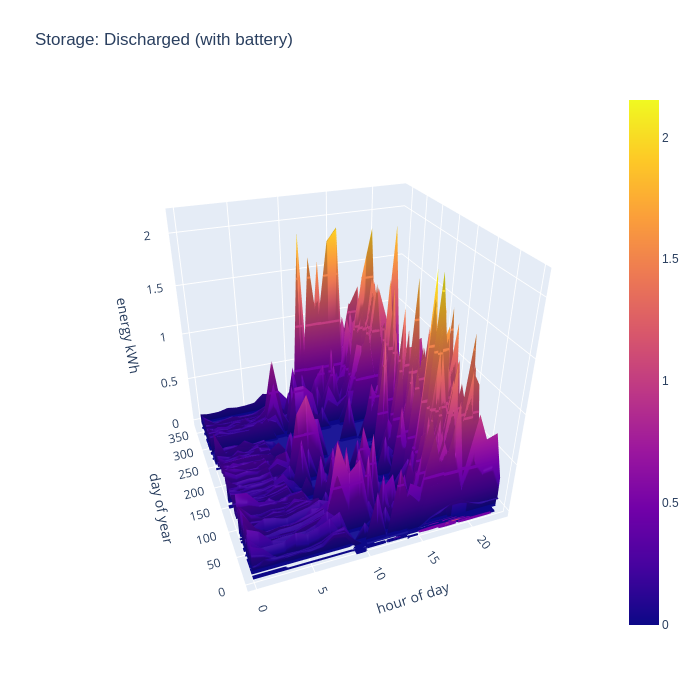
The battery discharge pattern is perhaps the more interesting of the two charts, as it shows exactly when the benefit of the battery is most felt. In summer there are some peaks of discharge at the start of the day, this reflects some temporary loads which exceed the available generation, such as running the dishwasher or washing machine. In the middle of the day there is very little discharge except for winter months, but the evening is there is really shines. The solar PV generation has peaked, but there is still major consumption demand for cooking dinner on an electric induction hob, and/or oven, and the periodic use of a tumble dryer. Finally the battery takes up the load throughout the night when there is zero PV generation, but fairly low baseline demand.
Again the charge and discharge charts can be combined to show the flow in (positive) and out (negative) of the battery
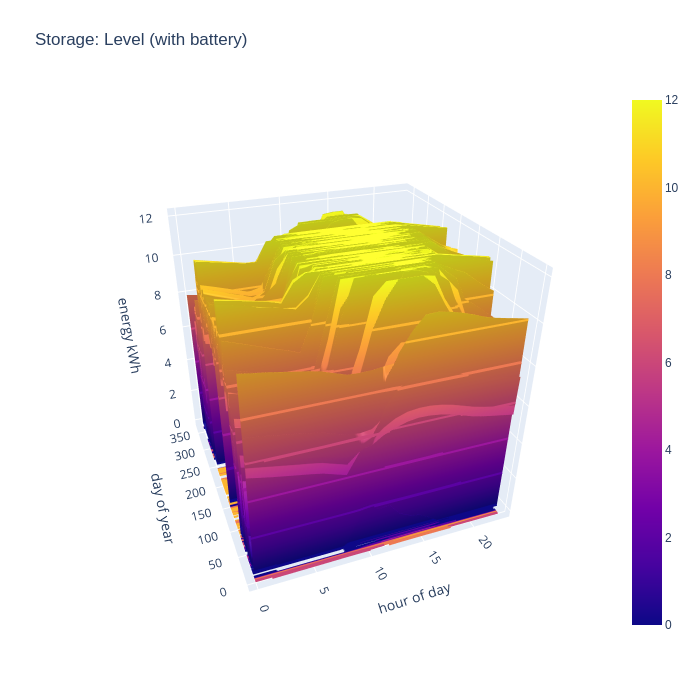
The final chart to look at is the battery charge level, which will give an idea of how well sized the battery is. If it never reaches a 100% full state, then it is likely oversized, but if it spends the whole year at 100% full state, then it is likely undersized. The ideal with be tradeoff somewhere in between, perhaps with a battery large enough to eliminate grid import for perhaps the middle 50% of the year, showing periods of strong charge and discharge.
With this walkthrough complete, the potential benefits of having fine grained electricity consumption data from smart meters is becoming more apparent. Having access to both consumption and generation data for your home and its location allows evaluation of an arbitrary number of different solar PV + battery storage deployment options, where a commercial installer might only show 2-3 scenarios at most.
There are still many limitations to the visualization that should be kept in mind
- The electricity consumption data reflects a point in time before solar PV is installed, and it is commonly reported that people tend to change their usage patterns to take most advantage of free electricity they’ve got available. IOW, the level of self-consumption in the no-battery scenario is probably understated, while the potential gain in self-consumption from adding a battery is slightly over-stated.
- The electricity consumption data reflects one year, while the PVGIS solar irradiation data is from a different year. Electricity consumption may well vary depending on weather, for example increased use of tumble dryers when it is cloudy and wet, or decreased use of ovens when it is hot. Or the year chosen for either consumption or generation data may have quirks that makes it non-representative of a typical year. It could be worth trying different years for the PVGIS data to see if it impacts the results produced. An enhancement would be for the tool to average PVGIS data from a number of years in particular.
- The data is being processed at 1 hour granularity, with an assumption that generation and consumption is spread evenly across the hour. In reality this does not likely line up so well, and so self-consumption in the no battery scenario is likely overstated. The with battery charts, however, are likely to be fairly unaffected as the battery will easily compensate for short term mis-matches in generation and consumption
- In houses with hot water storage cylinders, it is very common to fit a solar diverter, such that when there is excess generation, it will be used to heat hot water instead of being exported to the grid. Thus the level of grid export is likely overstated, and self-consumption understated. There is also no visualization of the reduction in gas bill from the use of free electricity to heat water instead of a gas heater. Thus the potential benefits from having home storage batteries will be overstated to some degree.
- In houses with EV chargers, it is also typical to divert excess generation into the car, so again the level of grid export is likely overstated and self-consumption understated. Again this will have the effect of overstating the benefits of a home stokrage battery.
- The generation figures don’t take into account losses from the equipment, or localized degradation from shading on individual panels
- The consumption figures don’t reflect potential future changes in usage. For example, if the gas boiler were to be replaced by a heat pump, demand in the winter months in particular would massively increase, and summer months would increase to some extent for heating of hot water. This might push towards oversizing the PV array in the short term.
Despite these caveats, the visualization should still be very beneficial in evaluating different solar PV and battery installation scenarios.
I am pleased to announce that a new release of the libvirt-glib package, version 5.0.0, is now available from
https://libvirt.org/sources/glib/
The packages are GPG signed with
Key fingerprint: DAF3 A6FD B26B 6291 2D0E 8E3F BE86 EBB4 1510 4FDF (4096R)
Changes in this release:
- Fix compatiblity with libxml2 >= 2.12.0
- Bump min libvirt version to 2.3.0
- Bump min meson to 0.56.0
- Require use of GCC >= 4.8 / CLang > 3.4 / XCode CLang > 5.1
- Mark USB disks as removable by default
- Add support for audio device backend config
- Add support for DBus graphics backend config
- Add support for controlling firmware feature flags
- Improve compiler flag handling in meson
- Extend library version script handling to FreeBSD
- Fix pointer sign issue in capabilities config API
- Fix compat with gnome.mkenums() in Meson 0.60.0
- Avoid compiler warnings from gi-ir-scanner generated code by not setting glib version constraints
- Be more robust about NULL GError parameters
- Disable unimportant cast alignment compiler warnings
- Use ‘pragma once’ in all header files
- Updated translations
Thanks to everyone who contributed to this new release.
The x86 platform has been ever so slowly moving towards a world where EFI is used to boot everything, with legacy BIOS put out to pasture. Virtual machines in general have been somewhat behind the cutting edge in this respect though. This has mostly been due to the virtualization and cloud platforms being somewhat slow in enabling use of EFI at all, let alone making it the default. In a great many cases the platforms still default to using BIOS unless explicitly asked to use EFI. With this in mind most the mainstream distros tend to provide general purpose disk images built such that they can boot under either BIOS or EFI, thus adapting to whatever environment the user deploys them in.
In recent times there is greater interest in the use of TPM sealing and SecureBoot for protecting guest secrets (eg LUKS passphrases), the introduction of UKIs as the means to extend the SecureBoot signature to close initrd/cmdline hole, and the advent of confidential virtualization technology. These all combine to increase the liklihood that a virtual machine image will exclusively target EFI, fully discontinuing support for legacy BIOS.
This presents a bit of a usability trapdoor for people deploying images though, as it has been taken for granted that BIOS boot always works. If one takes an EFI only disk image and attempts to boot it via legacy BIOS, the user is likely to get an entirely blank graphical display and/or serial console, with no obvious hint that EFI is required. Even if the requirement for EFI is documented, it is inevitable that users will make mistakes.
Can we do better than this ? Of course we can.
Enter ‘Bye Bye BIOS‘ (https://gitlab.com/berrange/byebyebios)
This is a simple command line tool that, when pointed to a disk image, will inject a MBR sector that prints out a message to the user on the primary VGA display and serial port informing them that UEFI is required, then puts the CPUs in a ‘hlt‘ loop.
The usage is as follows, with a guest serial port connected to the local terminal:
$ byebyebios test.img
$ qemu-system-x86_64 \
    -blockdev driver=file,filename=test.img,node-name=img \
    -device virtio-blk,drive=img \
    -m 2000 -serial stdio

STOP: Machine was booted from BIOS or UEFI CSM
 _    _         _   _ ___________ _____   ___
| \  | |       | | | |  ___|  ___|_   _| |__ \
|  \ | | ___   | | | | |__ | |_    | |      ) |
| . `  |/ _ \  | | | |  __||  _|   | |     / /
| |\   | (_) | | |_| | |___| |    _| |_   |_|
\_| \_/ \___/   \___/\____/\_|    \___/   (_)

Installation requires UEFI firmware to boot
Meanwhile the graphical console shows the same:
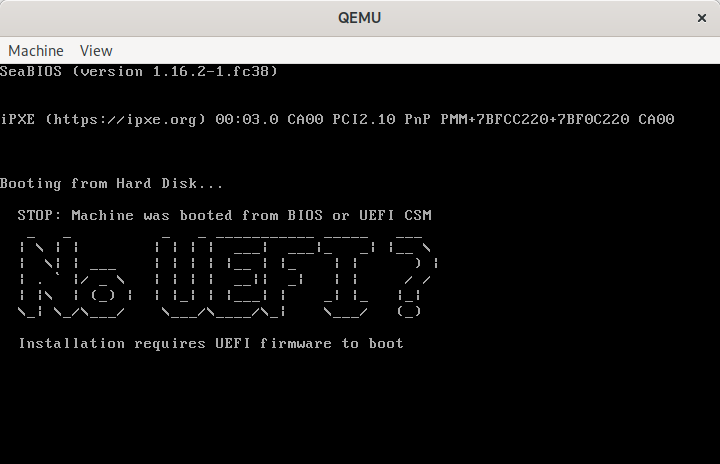
QEMU showing “No UEFI” message when booted from BIOS
The message shown here is a default, but it can be customized by pointing to an alternative message file
$ echo "Bye Bye BIOS" | figlet -f bubble | unix2dos > msg.txt
$ byebyebios --message msg.txt test.img
$ qemu-system-x86_64 \
    -blockdev driver=file,filename=test.img,node-name=img \
    -device virtio-blk,drive=img \
    -m 2000 -serial stdio

  _   _   _     _   _   _     _   _   _   _
 / \ / \ / \   / \ / \ / \   / \ / \ / \ / \
( B | y | e ) ( B | y | e ) ( B | I | O | S )
 \_/ \_/ \_/   \_/ \_/ \_/   \_/ \_/ \_/ \_/
The code behind this is simplicity itself, just a short piece of x86 asm
$ cat bootstub.S
# SPDX-License-Identifier: MIT-0

.code16
.global bye_bye_bios

bye_bye_bios:
  mov $something_important, %si
  mov $0xe, %ah
  mov $0x3f8,%dx

say_a_little_more:
  lodsb
  cmp $0, %al
  je this_is_the_end
  int $0x10
  outb %al,%dx
  jmp say_a_little_more

this_is_the_end:
  hlt
  jmp this_is_the_end

something_important:
# The string message will be appended here at time of install
This is compiled with the GNU assembler to create a i486 ELF object file
$ as -march i486 -mx86-used-note=no --32 -o bootstub.o bootstub.S
From this ELF object file we have to extract the raw machine code bytes
$ ld -m elf_i386 --oformat binary -e bye_bye_bios -Ttext 0x7c00 -o bootstub.bin bootstub.o
The byebyebios python tool takes this bootstub.bin, appends the text message and NUL terminator, padding to fill 446 bytes, then adds a dummy partition table and boot signature to fill the whole 512 sector.
With the boot stub binary at 21 bytes in size, this leaves 424 bytes available for the message to display to the user, which is ample for the purpose.
In conclusion, if you need to ship an EFI only virtual machine image, do your users a favour and use byebyebios to add a dummy MBR to tell them that the image is EFI only when they inevitably make a mistake and run it under legacy BIOS.
As a virtualization developer a significant amount of time is spent in understanding and debugging the behaviour and interaction of QEMU and the guest kernel/userspace code. As such my development machines have a variety of guest OS installations that get booted for various tasks. Some tasks, however, require a repeated cycle of QEMU code changes, or QEMU config changes, followed by guest testing. Waiting for an OS to boot can quickly become a significant time sink affecting productivity and lead to frustration. What is needed is a very low overhead way to accomplish simple testing tasks without an OS getting in the way.
Enter ‘make-tiny-image.py‘ tool for creating minimal initrd images.
If invoked with no arguments, this tool will create an initrd containing nothing more than busybox. The “init” program will be a script that creates a few device nodes, mounts proc/sysfs and then runs the busybox ‘sh’ binary to provide an interactive shell. This is intended to be used as follows
$ ./make-tiny-image.py
tiny-initrd.img
6.0.8-300.fc37.x86_64

$ qemu-system-x86_64 \
    -kernel /boot/vmlinuz-$(uname -r) \
    -initrd tiny-initrd.img \
    -append 'console=ttyS0 quiet' \
    -accel kvm -m 1000 -display none -serial stdio
~ # uname  -a
Linux (none) 6.0.8-300.fc37.x86_64 #1 SMP PREEMPT_DYNAMIC Fri Nov 11 15:09:04 UTC 2022 x86_64 x86_64 x86_64 Linux
~ # uptime
 15:05:42 up 0 min,  load average: 0.00, 0.00, 0.00
~ # free
              total        used        free      shared  buff/cache   available
Mem:         961832       38056      911264        1388       12512      845600
Swap:             0           0           0
~ # df
Filesystem           1K-blocks      Used Available Use% Mounted on
none                    480916         0    480916   0% /dev
~ # ls
bin   dev   init  proc  root  sys   usr
~ # <Ctrl+D>
[   23.841282] reboot: Power down
When I say “low overhead”, just how low are we talking about ? With KVM, it takes less than a second to bring up the shell. Testing with emulation is where this really shines. Booting a full Fedora OS with QEMU emulation is slow enough that you don’t want to do it at all frequently. With this tiny initrd, it’ll take a little under 4 seconds to boot to the interactive shell. Much slower than KVM, but fast enough you’ll be fine repeating this all day long, largely unaffected by the (lack of) speed relative to KVM.
The make-tiny-image.py tool will create the initrd such that it drops you into a shell, but it can be told to run another command instead. This is how I tested the overheads mentioned above
$ ./make-tiny-image.py --run poweroff
tiny-initrd.img
6.0.8-300.fc37.x86_64

$ time qemu-system-x86_64 \
     -kernel /boot/vmlinuz-$(uname -r) \
     -initrd tiny-initrd.img \
     -append 'console=ttyS0 quiet' \
     -m 1000 -display none -serial stdio -accel kvm
[    0.561174] reboot: Power down

real	0m0.828s
user	0m0.613s
sys	0m0.093s
$ time qemu-system-x86_64 \
     -kernel /boot/vmlinuz-$(uname -r) \
     -initrd tiny-initrd.img \
     -append 'console=ttyS0 quiet' \
     -m 1000 -display none -serial stdio -accel tcg
[    2.741983] reboot: Power down

real	0m3.774s
user	0m3.626s
sys	0m0.174s
As a more useful real world example, I wanted to test the effect of changing the QEMU CPU configuration against KVM and QEMU, by comparing at the guest /proc/cpuinfo.
$ ./make-tiny-image.py --run 'cat /proc/cpuinfo'
tiny-initrd.img
6.0.8-300.fc37.x86_64

$ qemu-system-x86_64 \
    -kernel /boot/vmlinuz-$(uname -r) \
    -initrd tiny-initrd.img \
    -append 'console=ttyS0 quiet' \
    -m 1000 -display none -serial stdio -accel tcg -cpu max | grep '^flags'
flags		: fpu de pse tsc msr pae mce cx8 apic sep mtrr pge mca
                  cmov pat pse36 clflush acpi mmx fxsr sse sse2 ss syscall
                  nx mmxext pdpe1gb rdtscp lm 3dnowext 3dnow rep_good nopl
                  cpuid extd_apicid pni pclmulqdq monitor ssse3 cx16 sse4_1
                  sse4_2 movbe popcnt aes xsave rdrand hypervisor lahf_lm
                  svm cr8_legacy abm sse4a 3dnowprefetch vmmcall fsgsbase
                  bmi1 smep bmi2 erms mpx adx smap clflushopt clwb xsaveopt
                  xgetbv1 arat npt vgif umip pku ospke la57

$ qemu-system-x86_64 \
    -kernel /boot/vmlinuz-$(uname -r) \
    -initrd tiny-initrd.img \
    -append 'console=ttyS0 quiet' \
    -m 1000 -display none -serial stdio -accel kvm -cpu max | grep '^flags'
flags		: fpu vme de pse tsc msr pae mce cx8 apic sep mtrr pge mca
                  cmov pat pse36 clflush mmx fxsr sse sse2 ss syscall nx
                  pdpe1gb rdtscp lm constant_tsc arch_perfmon rep_good
                  nopl xtopology cpuid tsc_known_freq pni pclmulqdq vmx
                  ssse3 fma cx16 pdcm pcid sse4_1 sse4_2 x2apic movbe
                  popcnt tsc_deadline_timer aes xsave avx f16c rdrand
                  hypervisor lahf_lm abm 3dnowprefetch cpuid_fault
                  invpcid_single ssbd ibrs ibpb stibp ibrs_enhanced
                  tpr_shadow vnmi flexpriority ept vpid ept_ad fsgsbase
                  tsc_adjust sgx bmi1 avx2 smep bmi2 erms invpcid mpx
                  rdseed adx smap clflushopt xsaveopt xsavec xgetbv1
                  xsaves arat umip sgx_lc md_clear arch_capabilities
NB, with the list of flags above, I’ve manually line wrapped the output for saner presentation in this blog rather than have one giant long line.
These examples have relied on tools provided by busybox, but we’re not limited by that. It is possible to tell it to copy in arbitrary extra binaries from the host OS by just listing their name. If it is a dynamically linked ELF binary, it’ll follow the ELF header dependencies, pulling in any shared libraries needed.
$ ./make-tiny-image.py hwloc-info lstopo-no-graphics
tiny-initrd.img
6.0.8-300.fc37.x86_64
Copy bin /usr/bin/hwloc-info -> /tmp/make-tiny-imagexu_mqd99/bin/hwloc-info
Copy bin /usr/bin/lstopo-no-graphics -> /tmp/make-tiny-imagexu_mqd99/bin/lstopo-no-graphics
Copy lib /lib64/libhwloc.so.15 -> /tmp/make-tiny-imagexu_mqd99/lib64/libhwloc.so.15
Copy lib /lib64/libc.so.6 -> /tmp/make-tiny-imagexu_mqd99/lib64/libc.so.6
Copy lib /lib64/libm.so.6 -> /tmp/make-tiny-imagexu_mqd99/lib64/libm.so.6
Copy lib /lib64/ld-linux-x86-64.so.2 -> /tmp/make-tiny-imagexu_mqd99/lib64/ld-linux-x86-64.so.2
Copy lib /lib64/libtinfo.so.6 -> /tmp/make-tiny-imagexu_mqd99/lib64/libtinfo.so.6

$ qemu-system-x86_64 -kernel /boot/vmlinuz-$(uname -r) -initrd tiny-initrd.img -append 'console=ttyS0 quiet' -m 1000 -display none -serial stdio -accel kvm
~ # hwloc-info
depth 0:           1 Machine (type #0)
 depth 1:          1 Package (type #1)
  depth 2:         1 L3Cache (type #6)
   depth 3:        1 L2Cache (type #5)
    depth 4:       1 L1dCache (type #4)
     depth 5:      1 L1iCache (type #9)
      depth 6:     1 Core (type #2)
       depth 7:    1 PU (type #3)
Special depth -3:  1 NUMANode (type #13)
Special depth -4:  1 Bridge (type #14)
Special depth -5:  3 PCIDev (type #15)
Special depth -6:  1 OSDev (type #16)
Special depth -7:  1 Misc (type #17)

~ # lstopo-no-graphics
Machine (939MB total)
  Package L#0
    NUMANode L#0 (P#0 939MB)
    L3 L#0 (16MB) + L2 L#0 (4096KB) + L1d L#0 (32KB) + L1i L#0 (32KB) + Core L#0 + PU L#0 (P#0)
  HostBridge
    PCI 00:01.1 (IDE)
      Block "sr0"
    PCI 00:02.0 (VGA)
    PCI 00:03.0 (Ethernet)
  Misc(MemoryModule)
An obvious limitation is that if the binary/library requires certain data files, those will not be present in the initrd. It isn’t attempting to do anything clever like query the corresponding RPM file list and copy those. This tool is meant to be simple and fast and keep out of your way. If certain data files are critical for testing though, the --copy argument can be used. The copied files will be put at the same path inside the initrd as found on the host
$ ./make-tiny-image.py --copy /etc/redhat-release
tiny-initrd.img
6.0.8-300.fc37.x86_64
Copy extra /etc/redhat-release -> /tmp/make-tiny-imageicj1tvq4/etc/redhat-release

$ qemu-system-x86_64 \
    -kernel /boot/vmlinuz-$(uname -r) \
    -initrd tiny-initrd.img \
    -append 'console=ttyS0 quiet' \
    -m 1000 -display none -serial stdio -accel kvm
~ # cat /etc/redhat-release
Fedora release 37 (Thirty Seven)
What if the problem being tested requires using some kernel modules ? That’s covered too with the --kmod argument, which will copy in the modules listed, along with their dependencies and the insmod command itself. As an example of its utility, I used this recently to debug a regression in support for the iTCO watchdog in Linux kernels
$ ./make-tiny-image.py --kmod lpc_ich --kmod iTCO_wdt  --kmod i2c_i801
tiny-initrd.img
6.0.8-300.fc37.x86_64
Copy kmod /lib/modules/6.0.8-300.fc37.x86_64/kernel/drivers/mfd/lpc_ich.ko.xz -> /tmp/make-tiny-image63td8wbl/lib/modules/lpc_ich.ko.xz
Copy kmod /lib/modules/6.0.8-300.fc37.x86_64/kernel/drivers/watchdog/iTCO_wdt.ko.xz -> /tmp/make-tiny-image63td8wbl/lib/modules/iTCO_wdt.ko.xz
Copy kmod /lib/modules/6.0.8-300.fc37.x86_64/kernel/drivers/watchdog/iTCO_vendor_support.ko.xz -> /tmp/make-tiny-image63td8wbl/lib/modules/iTCO_vendor_support.ko.xz
Copy kmod /lib/modules/6.0.8-300.fc37.x86_64/kernel/drivers/mfd/intel_pmc_bxt.ko.xz -> /tmp/make-tiny-image63td8wbl/lib/modules/intel_pmc_bxt.ko.xz
Copy kmod /lib/modules/6.0.8-300.fc37.x86_64/kernel/drivers/i2c/busses/i2c-i801.ko.xz -> /tmp/make-tiny-image63td8wbl/lib/modules/i2c-i801.ko.xz
Copy kmod /lib/modules/6.0.8-300.fc37.x86_64/kernel/drivers/i2c/i2c-smbus.ko.xz -> /tmp/make-tiny-image63td8wbl/lib/modules/i2c-smbus.ko.xz
Copy bin /usr/sbin/insmod -> /tmp/make-tiny-image63td8wbl/bin/insmod
Copy lib /lib64/libzstd.so.1 -> /tmp/make-tiny-image63td8wbl/lib64/libzstd.so.1
Copy lib /lib64/liblzma.so.5 -> /tmp/make-tiny-image63td8wbl/lib64/liblzma.so.5
Copy lib /lib64/libz.so.1 -> /tmp/make-tiny-image63td8wbl/lib64/libz.so.1
Copy lib /lib64/libcrypto.so.3 -> /tmp/make-tiny-image63td8wbl/lib64/libcrypto.so.3
Copy lib /lib64/libgcc_s.so.1 -> /tmp/make-tiny-image63td8wbl/lib64/libgcc_s.so.1
Copy lib /lib64/libc.so.6 -> /tmp/make-tiny-image63td8wbl/lib64/libc.so.6
Copy lib /lib64/ld-linux-x86-64.so.2 -> /tmp/make-tiny-image63td8wbl/lib64/ld-linux-x86-64.so.2

$ ~/src/virt/qemu/build/qemu-system-x86_64 -kernel /boot/vmlinuz-$(uname -r) -initrd tiny-initrd.img -append 'console=ttyS0 quiet' -m 1000 -display none -serial stdio -accel kvm  -M q35 -global ICH9-LPC.noreboot=false -watchdog-action poweroff -trace ich9* -trace tco*
ich9_cc_read addr=0x3410 val=0x20 len=4
ich9_cc_write addr=0x3410 val=0x0 len=4
ich9_cc_read addr=0x3410 val=0x0 len=4
ich9_cc_read addr=0x3410 val=0x0 len=4
ich9_cc_write addr=0x3410 val=0x20 len=4
ich9_cc_read addr=0x3410 val=0x20 len=4
tco_io_write addr=0x4 val=0x8
tco_io_write addr=0x6 val=0x2
tco_io_write addr=0x6 val=0x4
tco_io_read addr=0x8 val=0x0
tco_io_read addr=0x12 val=0x4
tco_io_write addr=0x12 val=0x32
tco_io_read addr=0x12 val=0x32
tco_io_write addr=0x0 val=0x1
tco_timer_reload ticks=50 (30000 ms)
~ # mknod /dev/watchdog0 c 10 130
~ # cat /dev/watchdog0
tco_io_write addr=0x0 val=0x1
tco_timer_reload ticks=50 (30000 ms)
cat: read error: Invalid argument
[   11.052062] watchdog: watchdog0: watchdog did not stop!
tco_io_write addr=0x0 val=0x1
tco_timer_reload ticks=50 (30000 ms)
~ # tco_timer_expired timeouts_no=0 no_reboot=0/1
tco_timer_reload ticks=50 (30000 ms)
tco_timer_expired timeouts_no=1 no_reboot=0/1
tco_timer_reload ticks=50 (30000 ms)
tco_timer_expired timeouts_no=0 no_reboot=0/1
tco_timer_reload ticks=50 (30000 ms)
The Linux regression had accidentally left the watchdog with the ‘no reboot’ bit set, so it would never trigger the action, which we diagnosed from seeing repeated QEMU trace events for tco_timer_expired after triggering the watchdog in the guest. This was quicky fixed by the Linux maintainers.
In spite of being such a simple and crude script, with many, many, many unhandled edge cases, it has proved remarkably useful at enabling low overhead debugging of QEMU/Linux guest behaviour.
A recent thread on the Fedora development list about unified kernel images co-incided with work I’m involved in wrt confidential computing (AMD SEV[-SNP], Intel TDX, etc). In exploring the different options for booting virtual machines in a confidential computing environment, one of the problems that keeps coming up is that of validating the boot measurements of the initrd and kernel command line. The initrd is currently generated on the fly at the time the kernel is installed on a host, while the command line typically contains host specific UUIDs for filesystems or LUKS volumes. Before even dealing with those problems, grub2‘s support for TPMs causes pain due to its need to measure every single grub.conf configuration line that is executed into a PCR. Even with the most minimal grub.conf using autodiscovery based on the boot loader spec, the grub.conf boot measurements are horribly cumbersome to deal with.
With this in mind, in working on confidential virtualization, we’re exploring options for simplifying the boot process by eliminating any per-host variable measurements. A promising way of achieving this is to make use of sd-boot instead of grub2, and using unified kernel images pre-built and signed by the OS vendor. I don’t have enough familiarity with this area of Linux, so I’ve been spending time trying out the different options available to better understand their operation. What follows is a short description of how i took an existing Fedora 36 virtual machine and converted it to sd-boot with a unified kernel image.
First of all, I’m assuming that the virtual machine has been installed using UEFI (EDK2’s OOVMF build) as the firmware, rather than legacy BIOS (aka SeaBIOS). This is not the default with virt-manager/virt-install, but an opt-in is possible at time of provisioning the guest. Similarly it is possible to opt-in to adding a virtual TPM to the guest, for the purpose of receiving boot measurements. Latest upstream code for virt-manager/virt-install will always add a vTPM if UEFI is requested.
Assuming UEFI + vTPM are enabled for the guest, the default Fedora / RHEL setup will also result in SecureBoot being enabled in the guest. This is good in general, but the sd-boot shipped in Fedora is not currently signed. Thus for (current) testing, either disable SecureBoot, or manually sign the sd-boot binary with a local key and enroll that key with UEFI. SecureBoot isn’t immediately important, so the quickest option is disabling SecureBoot with the following libvirt guest XML config setup:
<os firmware='efi'>
  <type arch='x86_64' machine='pc-q35-6.2'>hvm</type>
  <firmware>
    <feature enabled='no' name='secure-boot'/>
  </firmware>
  <loader secure='no'/>
  <boot dev='hd'/>
</os>
The next time the guest is cold-booted, the ‘--reset-nvram‘ flag needs to be passed to ‘virsh start‘ to make it throwaway the existing SecureBoot enabled NVRAM and replace it with one disabling SecureBoot.
$ virsh start --reset-nvram fedora36test
Inside the guest, surprisingly, there were only two steps required, installing ‘sd-boot’ to the EFI partition, and building the unified kernel images. Installing ‘sd-boot’ will disable the use of grub, so don’t reboot after this first step, until the kernels are setup:
$ bootctl install
Created "/boot/efi/EFI/systemd".
Created "/boot/efi/loader".
Created "/boot/efi/loader/entries".
Created "/boot/efi/EFI/Linux".
Copied "/usr/lib/systemd/boot/efi/systemd-bootx64.efi" to "/boot/efi/EFI/systemd/systemd-bootx64.efi".
Copied "/usr/lib/systemd/boot/efi/systemd-bootx64.efi" to "/boot/efi/EFI/BOOT/BOOTX64.EFI".
Updated /etc/machine-info with KERNEL_INSTALL_LAYOUT=bls
Random seed file /boot/efi/loader/random-seed successfully written (512 bytes).
Not installing system token, since we are running in a virtualized environment.
Created EFI boot entry "Linux Boot Manager".
While the ‘/boot/efi/loader‘ directory could be populated with config files specifying kernel/initrd/cmdline to boot, the desire is to be able to demonstrate booting with zero host local configuration. So the next step is to build and install the unified kernel image. The Arch Linux wiki has a comprehensive guide, but the easiest option for Fedora appears to be to use dracut with its ‘--uefi‘ flag
$ for i in /boot/vmlinuz-*x86_64
do
   kver=${i#/boot/vmlinuz-}
   echo "Generating $kver"
   dracut  --uefi --kver $kver --kernel-cmdline "root=UUID=5fd49e99-6297-4880-92ef-bc31aef6d2f0 ro rd.luks.uuid=luks-6806c81d-4169-4e7a-9bbc-c7bf65cabcb2 rhgb quiet"
done
Generating 5.17.13-300.fc36.x86_64
Generating 5.17.5-300.fc36.x86_64
The observant will notice the ‘–kernel-cmdline’ argument refers to install specific UUIDs for the LUKS volume and root filesystem. This ultimately needs to be eliminated too, which would require configuring the guest disk image to comply with the discoverable partitions spec. That is beyond the scope of my current exercise of merely demonstrating use of sd-boot and unified kernels. It ought to be possible to write a kickstart file to automate creation of a suitable cloud image though.
At this point the VM is rebooted, and watching the graphical console confirms that the grub menu has disappeared and display output goes straight from the UEFI splash screen into Linux. There’s no menu shown by sd-boot by default, but if desired this can be enabled by editing /boot/efi/loader/loader.conf to uncomment the line timeout 3, at which point it will show the kernel version selection at boot.
If following this scheme, bear in mind that nothing is wired up to handle this during kernel updates. The kernel RPM triggers will continue to setup grub.conf and generate standalone initrds. IOW don’t try this on a VM that you care about. I assume there’s some set of commands I could use to uninstall sd-boot and switch back to grub, but I’ve not bothered to figure this out.
Overall this exercise was suprisingly simple and painless. The whole idea of using a drastically simplified boot loader instead of grub, along with pre-built unified kernel images, feels like it has alot of promise, especially in the context of virtual machines where the set of possible boot hardware variants is small and well understood.